Monitoring & Analytics
Monitoring is where rule quality becomes visible. Use this page for a fast operational check.
You should be able to answer four questions quickly:
- Are events flowing as expected?
- Which concrete transactions were just processed, and which rules fired for each one?
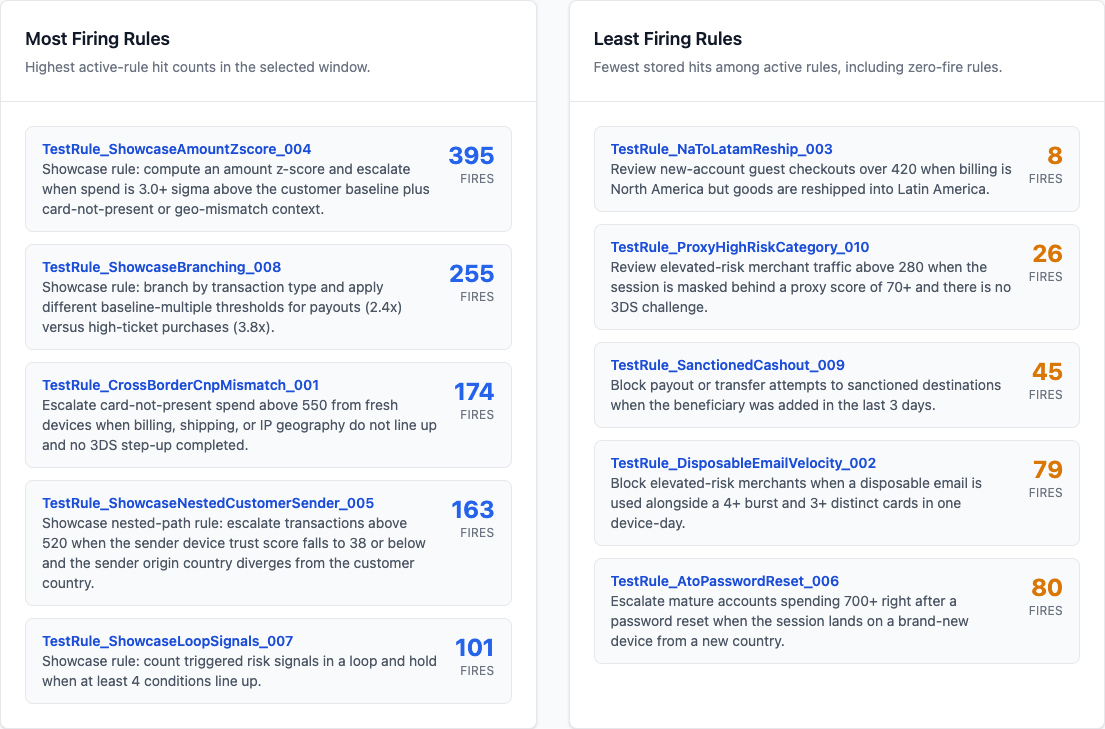
- Which active rules are currently noisy, and which active rules are silent?
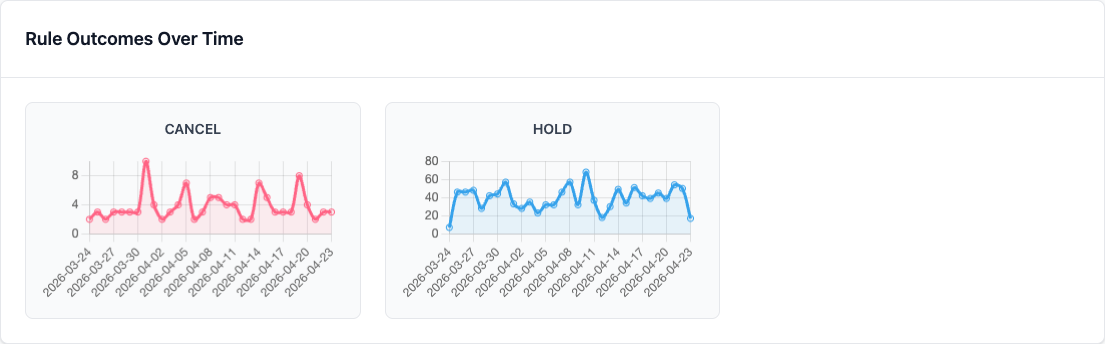
- Which outcomes are firing most often?
- Do labels confirm or contradict current rule behavior?
1) Check Event Flow (Dashboard)
Open Dashboard in the sidebar and verify:
- Active rules count is non-zero when rules are deployed
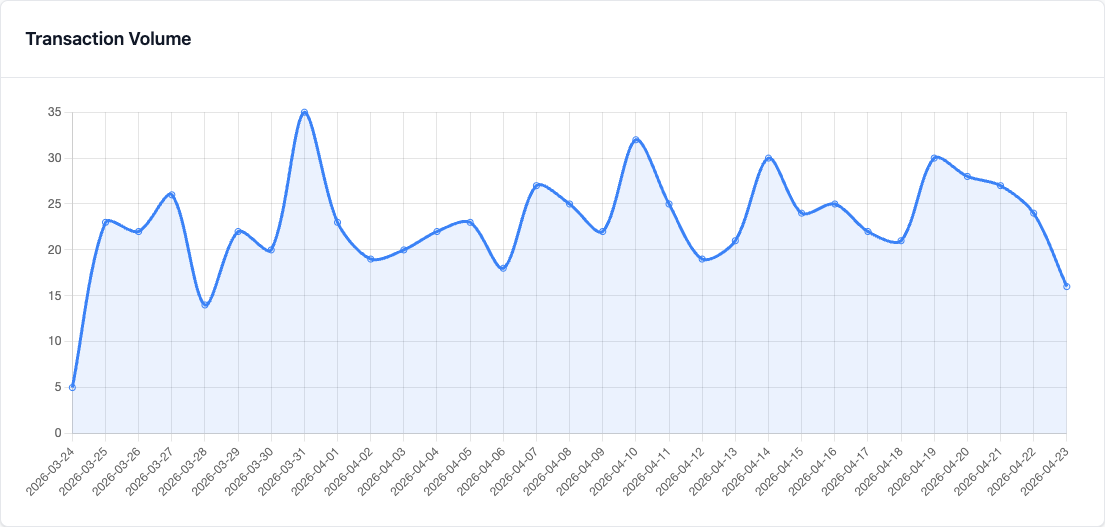
- Transaction volume chart has data in the selected window
- Most-firing and least-firing rule cards look plausible for the selected window
- Outcome charts move as you submit test or live events
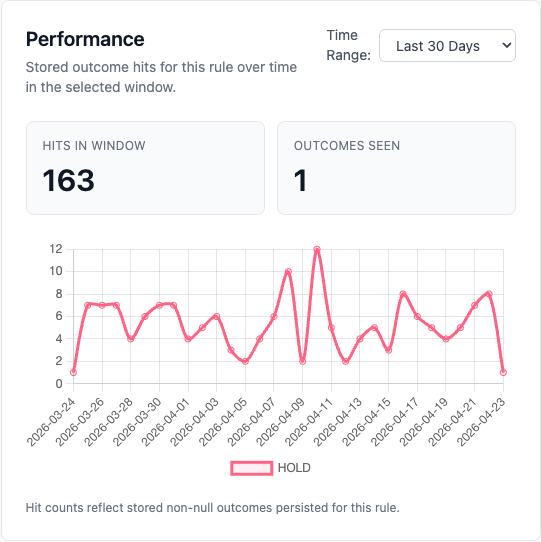
- Opening a ranked rule lets you inspect that rule's own Performance card and confirm which outcomes are firing over time
Use aggregation windows: 1h, 6h, 12h, 24h, 30d. For the first operational review, start with 30d so volume and outcome lines show trend shape rather than just recent activity.
Healthy signal:
- transaction volume is non-zero when your integration is sending events
- least-firing rules include active zero-hit rules instead of dropping them from the ranking
- outcome lines change after rule updates or test submissions
- the rule-detail performance chart shows the same rule generating plausible outcome counts in the time window you selected
Dashboard charts use the canonical served-decision ledger filtered to current transaction projections. Transaction volume counts current served evaluation_decisions per transaction_id; outcome and rule-activity charts count per-rule evaluation_rule_results for those current decisions. Time buckets are based on evaluation_decisions.evaluated_at, which shows when ezrules served the decision.
Use Alerts when an outcome needs active attention instead of passive chart review. Alert rules watch the same canonical served-decision ledger as the dashboard; for example, a rule can notify when CANCEL exceeds 50 served decisions in a rolling one-hour window. Alert incidents are recorded and delivered to the in-app notification bell. Celery beat also sweeps alert rules on a schedule so missed queue jobs are repaired after worker restarts.
2) Inspect Recent Tested Events
Open Tested Events in the sidebar and review the latest stored evaluations.
Use it to answer:
- Which event IDs were most recently stored
- Which uploaded labels have already been applied to those events
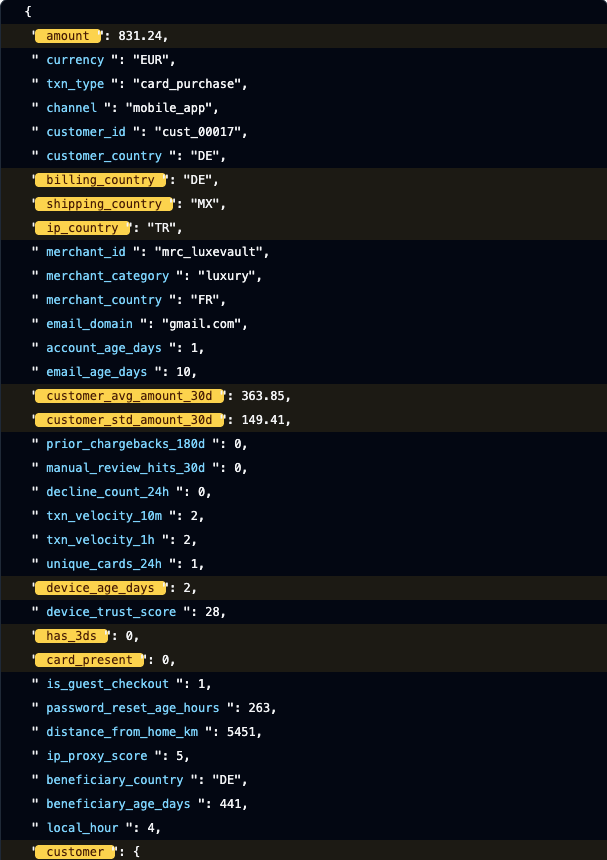
- What the raw event payload looked like
- Which rules actually fired for a given transaction
- What resolved outcome was persisted after severity resolution
Tips:
- Increase or decrease the Show latest selector to inspect a wider or narrower slice.
- Use the Uploaded Label column to verify that CSV-applied labels landed on the expected events.
- Expand a row to see the payload fields, every triggered rule, and the per-outcome counts for that event.
- When no rule is hovered, fields referenced by any triggered rule stay highlighted.
- Hover a specific triggered rule to narrow the payload highlight to just the fields that rule references.
- Events with NO OUTCOME passed through evaluation without any rule returning an allowed outcome.
Healthy signal:
- recent traffic appears quickly after calls to
POST /api/v2/evaluate - triggered rules match the rule logic you expect from the payload
3) Check Label Feedback (Analytics)
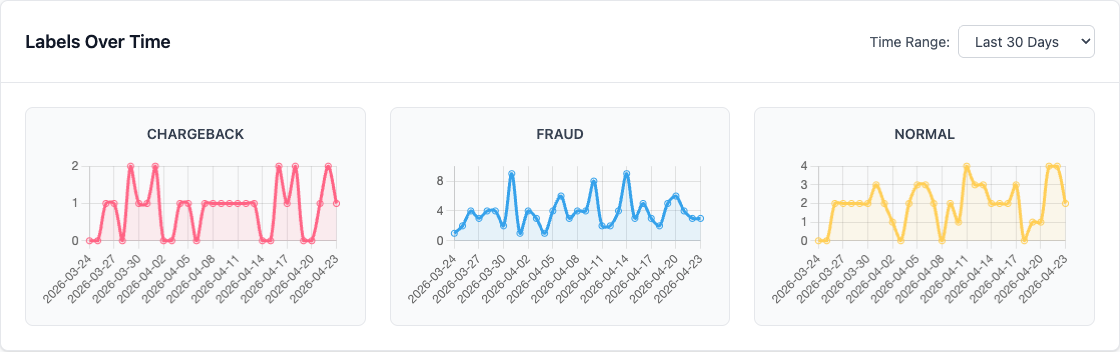
Open Analytics in the sidebar and verify:
- Total labeled events
- Label trends over time
- Aggregation window changes update the charts you are reviewing
If charts are empty, feed labels through:
POST /api/v2/labels/mark-eventPOST /api/v2/labels/upload
Healthy signal:
total labeledincreases after marking/uploading labels
4) Rank Rule Quality (Rule Quality Page)
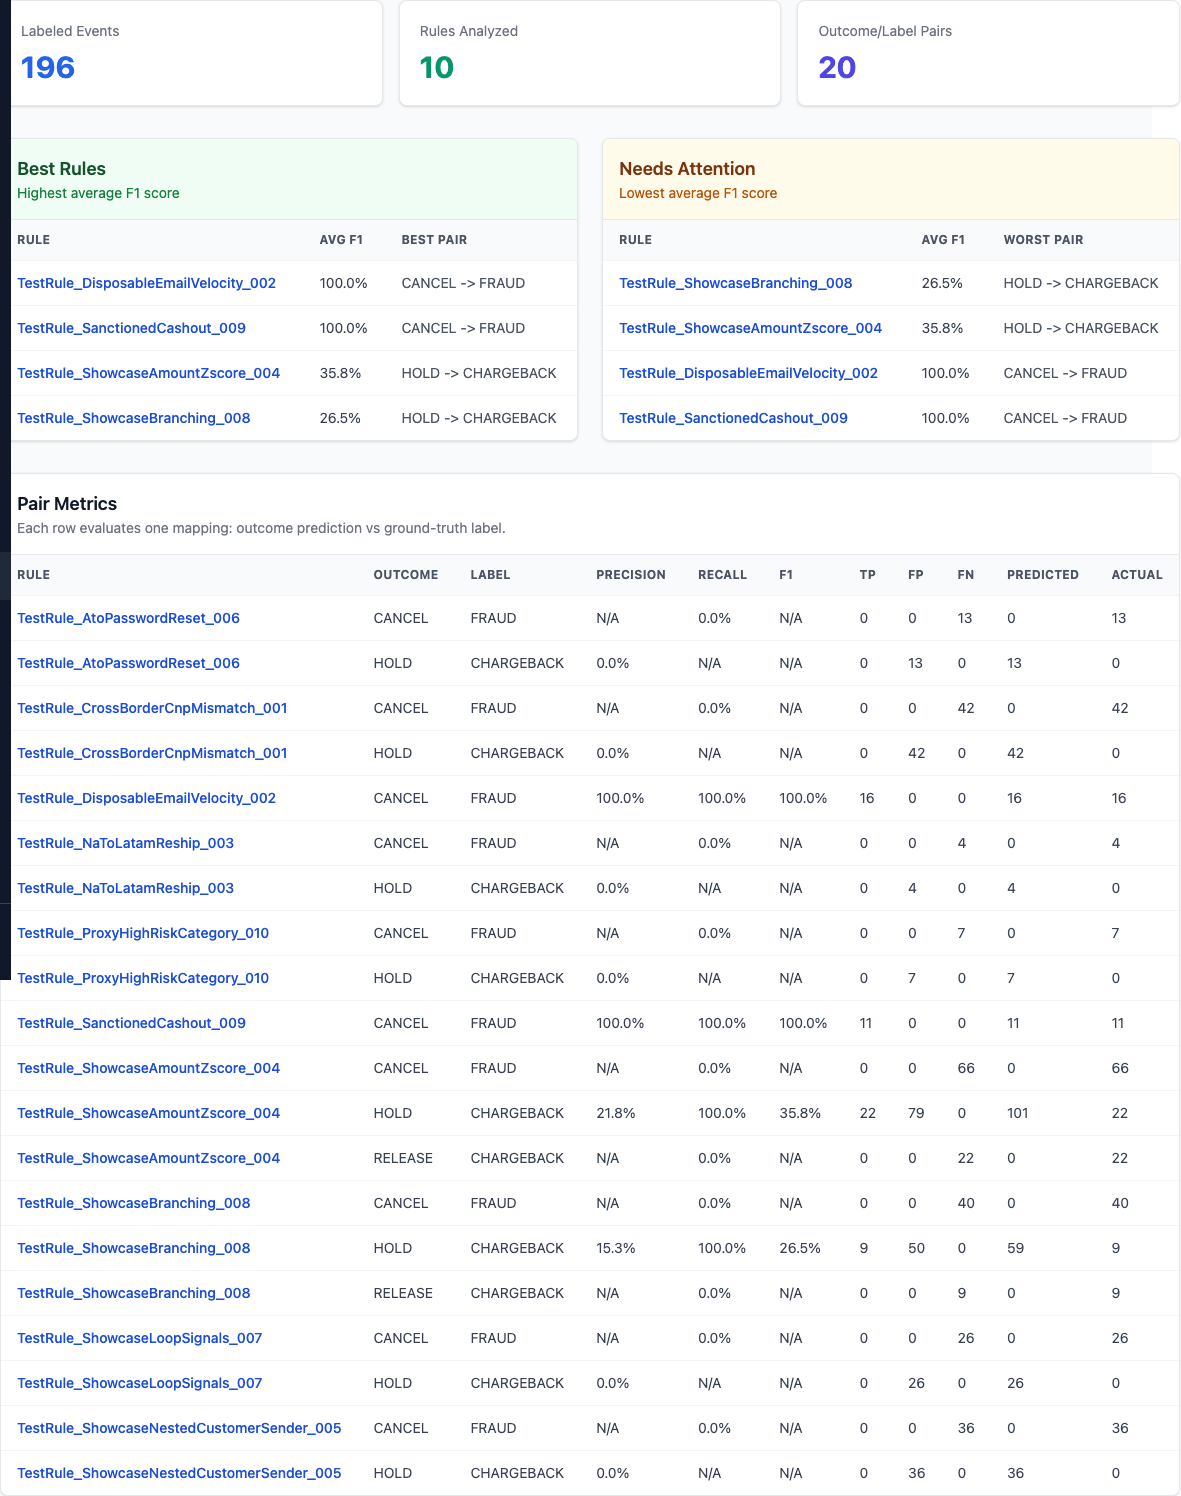
Open Rule Quality in the sidebar and review:
- Best rules (highest average F1)
- Needs attention (lowest average F1)
- Pair metrics table (
outcome -> label) with precision/recall/F1, TP/FP/FN for configured curated pairs
Tip:
- Increase Min support to filter noisy low-volume pairs.
- Use Lookback days to constrain query cost and focus on recent behavior.
- Default lookback can be managed under Settings → General.
- Rule Quality now loads an async snapshot report and shows Snapshot as of timestamp.
- Use Refresh Report when you need a newly frozen snapshot immediately.
- Configure curated pairs in Settings → General so reports focus only on the mappings your team tracks.
- Use the pair table to decide which outcome-label mapping best represents each rule.
Healthy signal:
- high precision on fraud-related mappings (few false positives)
- high recall on critical labels (few missed fraud labels)
5) Drill Down via API
GET /api/v2/tested-events?limit=50GET /api/v2/analytics/transaction-volume?aggregation=30dGET /api/v2/analytics/outcomes-distribution?aggregation=30dGET /api/v2/analytics/rules/{rule_id}/outcomes-distribution?aggregation=30dGET /api/v2/analytics/rule-activity?aggregation=30d&limit=5GET /api/v2/analytics/labels-summaryGET /api/v2/analytics/labels-distribution?aggregation=30dGET /api/v2/analytics/rule-quality?min_support=5&lookback_days=30POST /api/v2/analytics/rule-quality/reportsthenGET /api/v2/analytics/rule-quality/reports/{report_id}GET /api/v2/alerts/rulesGET /api/v2/alerts/incidentsGET /api/v2/notifications/unread-count
Tip: responses are structured for Chart.js (labels + dataset series).
Source-of-truth note: Dashboard volume, outcome, rule activity, per-rule performance, and labeled-transaction charts read canonical served decisions. Label analytics and rule quality use canonical event_version_labels linked to those served event versions.
SQL Checks
SELECT date_trunc('hour', ed.evaluated_at) AS hour,
       err.rule_result,
       COUNT(*) AS total
FROM evaluation_decisions ed
JOIN evaluation_rule_results err ON err.ed_id = ed.ed_id
WHERE ed.served = TRUE
  AND ed.decision_type = 'served'
  AND ed.evaluated_at >= NOW() - INTERVAL '7 days'
GROUP BY hour, err.rule_result
ORDER BY hour;
SELECT date_trunc('hour', ed.evaluated_at) AS hour,
       el.label,
       COUNT(*) AS total
FROM evaluation_decisions ed
JOIN event_version_labels evl ON evl.ev_id = ed.ev_id
JOIN event_labels el ON evl.el_id = el.el_id
WHERE ed.served = TRUE
  AND ed.decision_type = 'served'
GROUP BY hour, el.label
ORDER BY hour;
6) Common Symptoms
| Symptom | Likely Cause | Fix |
|---|---|---|
| Tested Events page is empty | No events have been persisted yet | Send traffic to POST /api/v2/evaluate or seed demo/test data |
| Dashboard charts are empty | No recent events in selected window | Submit new events and switch aggregation to 30d |
| Outcome charts empty but volume exists | Rules return no allowed outcomes | Verify rule returns valid outcomes and outcome exists in Outcomes |
| Label charts empty | No labels marked/uploaded | Add labels via UI workflow or POST /api/v2/labels/mark-event |
| Rule quality page empty | No labeled events or support threshold too high | Label events first, then reduce Min support |
API returns 400 for analytics |
Invalid aggregation value |
Use one of 1h, 6h, 12h, 24h, 30d |
For deeper symptom -> cause -> fix entries, use the Troubleshooting Guide.
For request/response schemas, use OpenAPI docs at http://localhost:8888/docs.